| Title | Quicklook | Description | Place | Time Period of Content | Download |
|---|---|---|---|---|---|
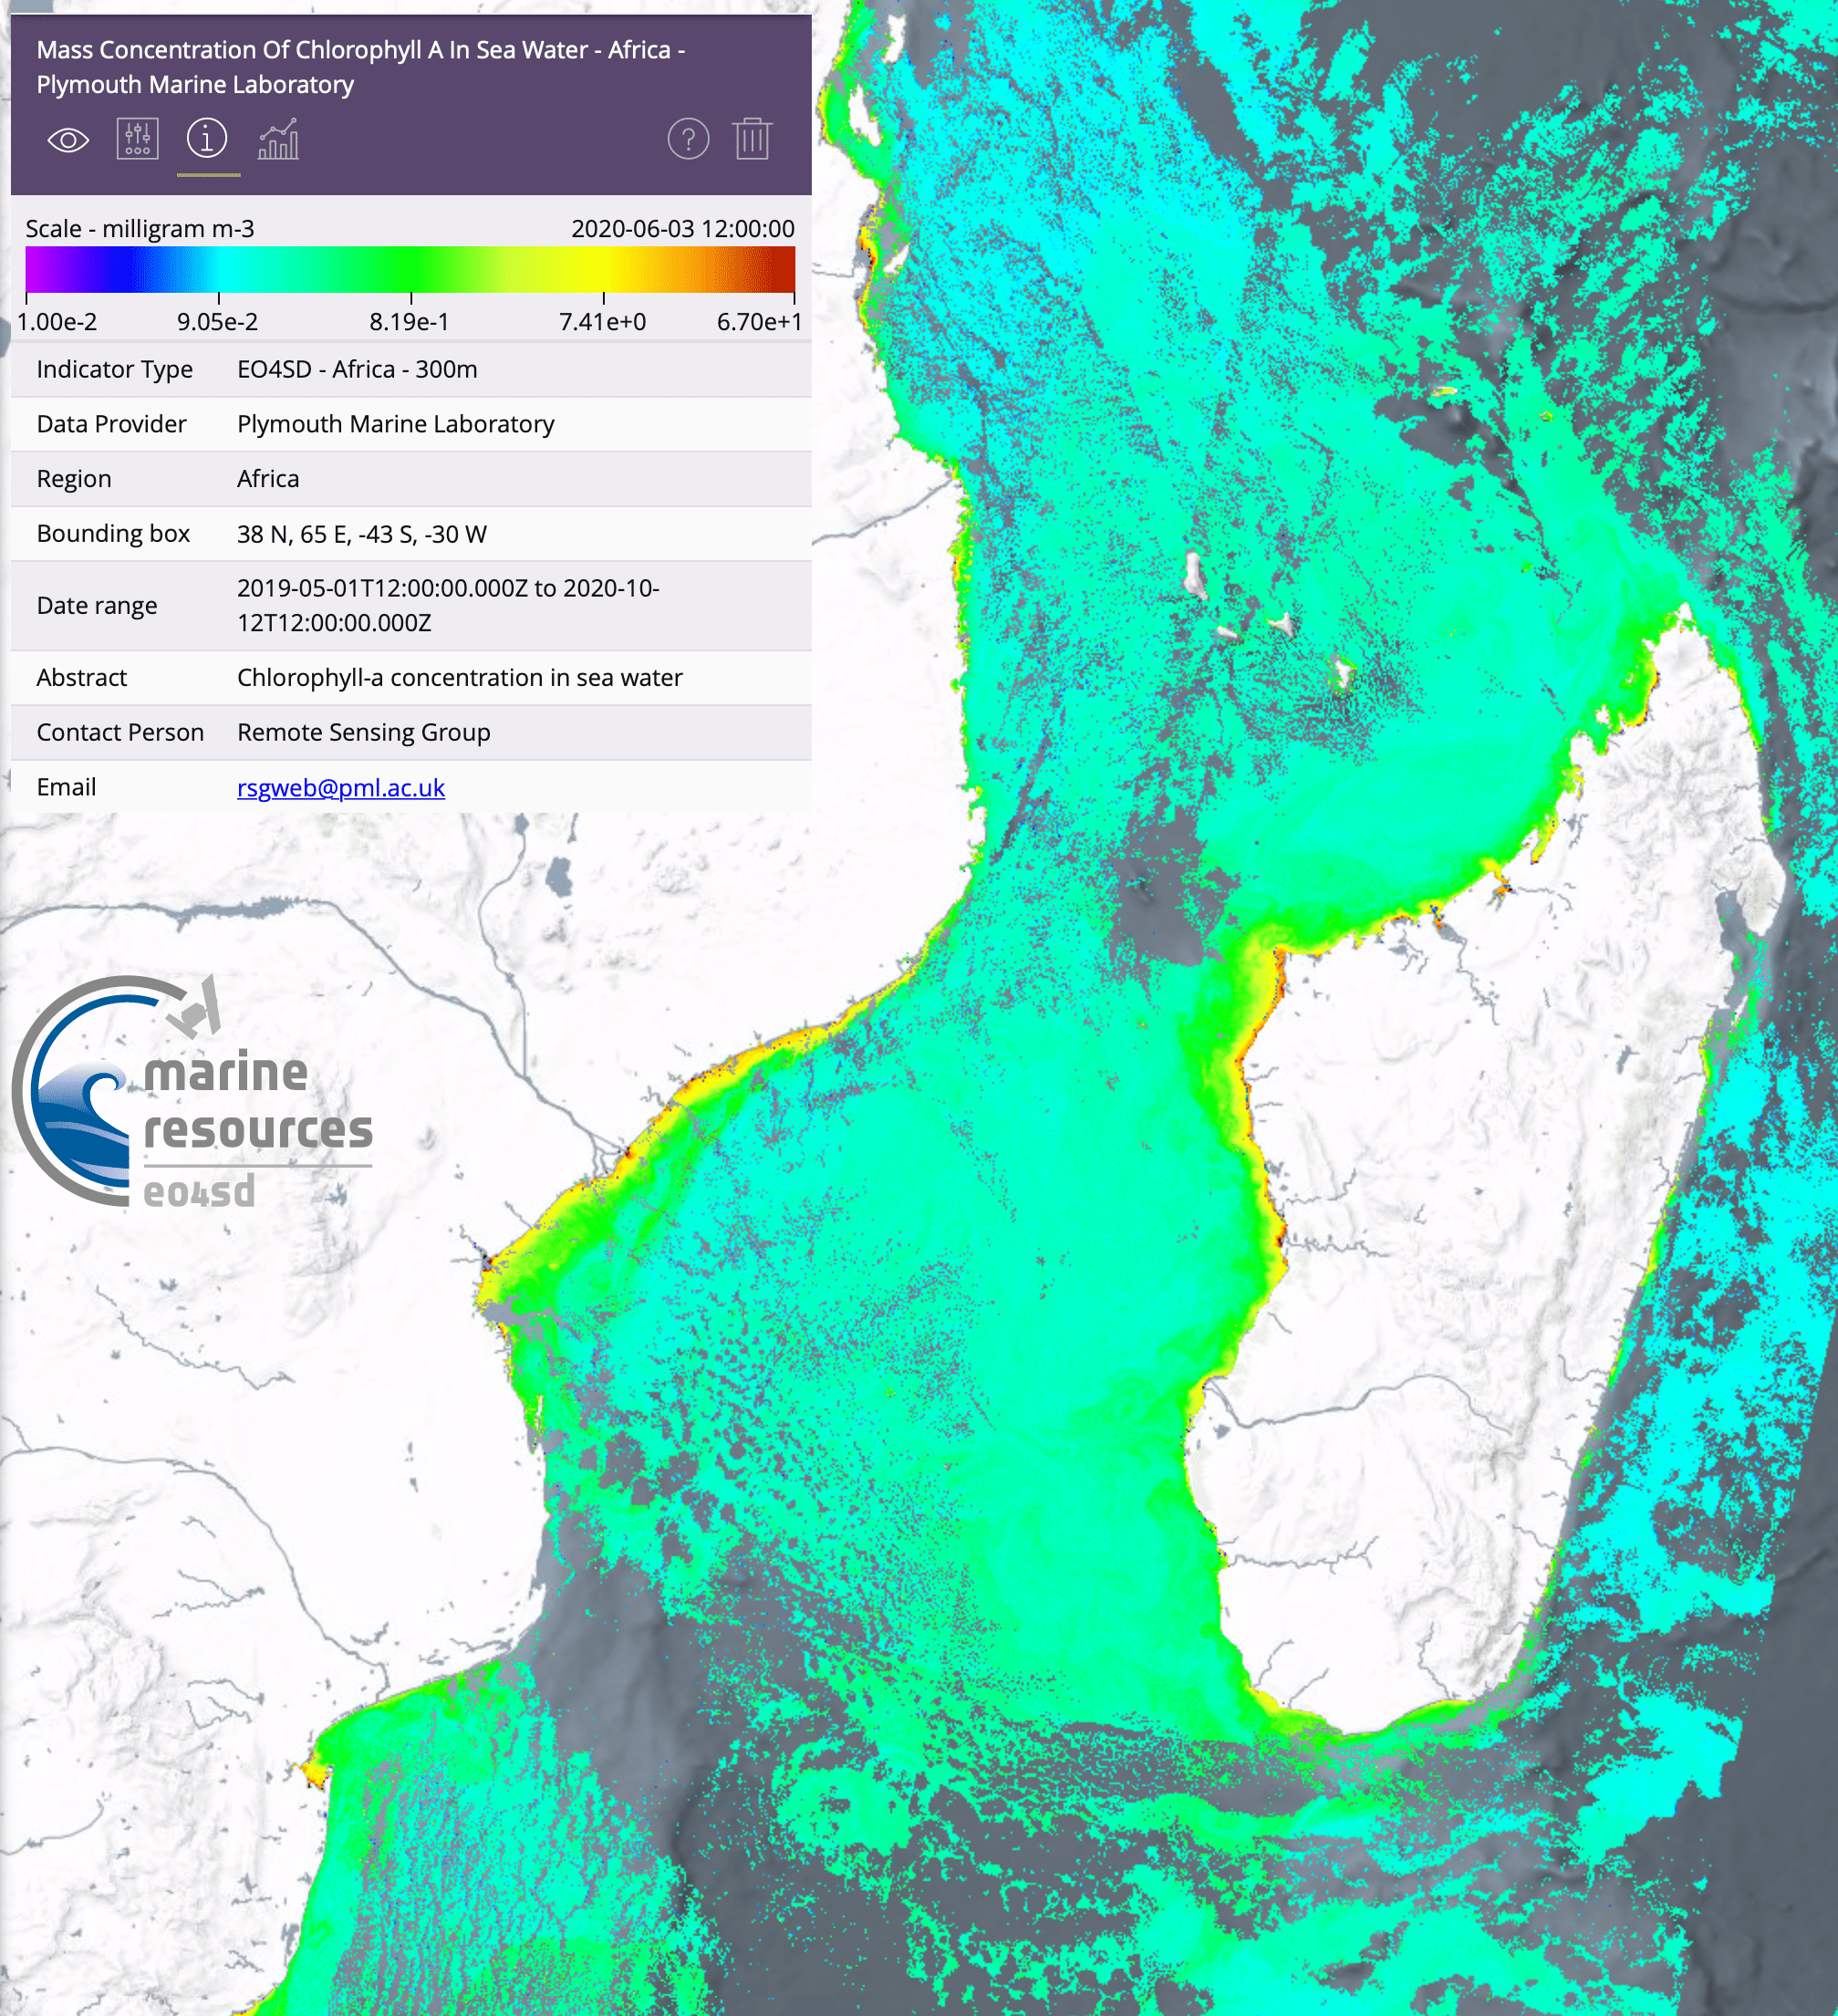
| Water quality for large geographical regions |
 (2 MB) |
Example of a Chl-a map for the Western Indian Ocean | Mozambique Madagascar |
June 04, 2020 | Example
in GIS portal Portuguese User Guide (PDF, 5.5MB) |
| Mozambique Historical Shorelines, Shoreline Change Rates (2000-2020) and 10- and 20-year forecast - Version 1 |  (287 KB) |
Version 1 - Unvalidated and occasional mis co-registration between shorelines from Landsat imagery which can skew change rates.This layer consists of data used to map shoreline change rates in Mozambique produced by the National Oceanopgrahy Centre for the Marine and Coastal Resources project under the initiative Earth Observation for Sustainable Development (EO4SD) by the European Space Agency. Geodatabase contains: Admin boundary - administrative boundary of coastline Mozambique Shorelines - Each shoreline delineated from the 20-year period Forecast 10 [years] Forecast 20 [years] Forecast Uncertainty 10 [years] Forecast Uncertainty 20 [years] Shoreline change rates - transects Historical shorelines between 2000-2020 can be visualised, created by annual median composites of Landat 7 and 8 imagery which delineates the approximate mean high water mark. Methods are inspired by Coastsat, a Google Earth Engine-enabled open-source software toolkit that delineates shorelines at any sandy coastline worldwide from over 30 years of publicly available satellite imagery (https://github.com/kvos/CoastSat). |
Mozambique | 2000 - 2020 |
Shapefiles (ZIP, 88.8 KB) GDB file (ZIP, 46.5 MB) Metadata (XML, 8 KB) |
| Land-based pollution 2019-2020 (1000m from shoreline). Service - Land-based pollution | 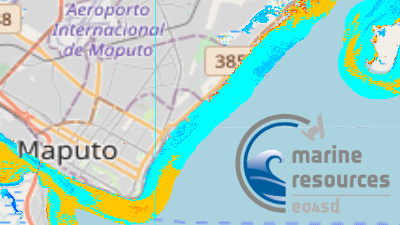 |
Land-based pollution of suspended and dissolved waste.Based on Sentinel-2 MSI images level 2A. The calculations are performed for a buffer about 1000 m off shore. Covering the area for the last 12 months period between 2019 and 2020. |
Maputo | 20190101 - 20201231 |
Quicklooks (ZIP, 6.7 MB) GeoTIFFs (ZIP, 13.1 MB) Metadata (XML, 4.6 KB) |
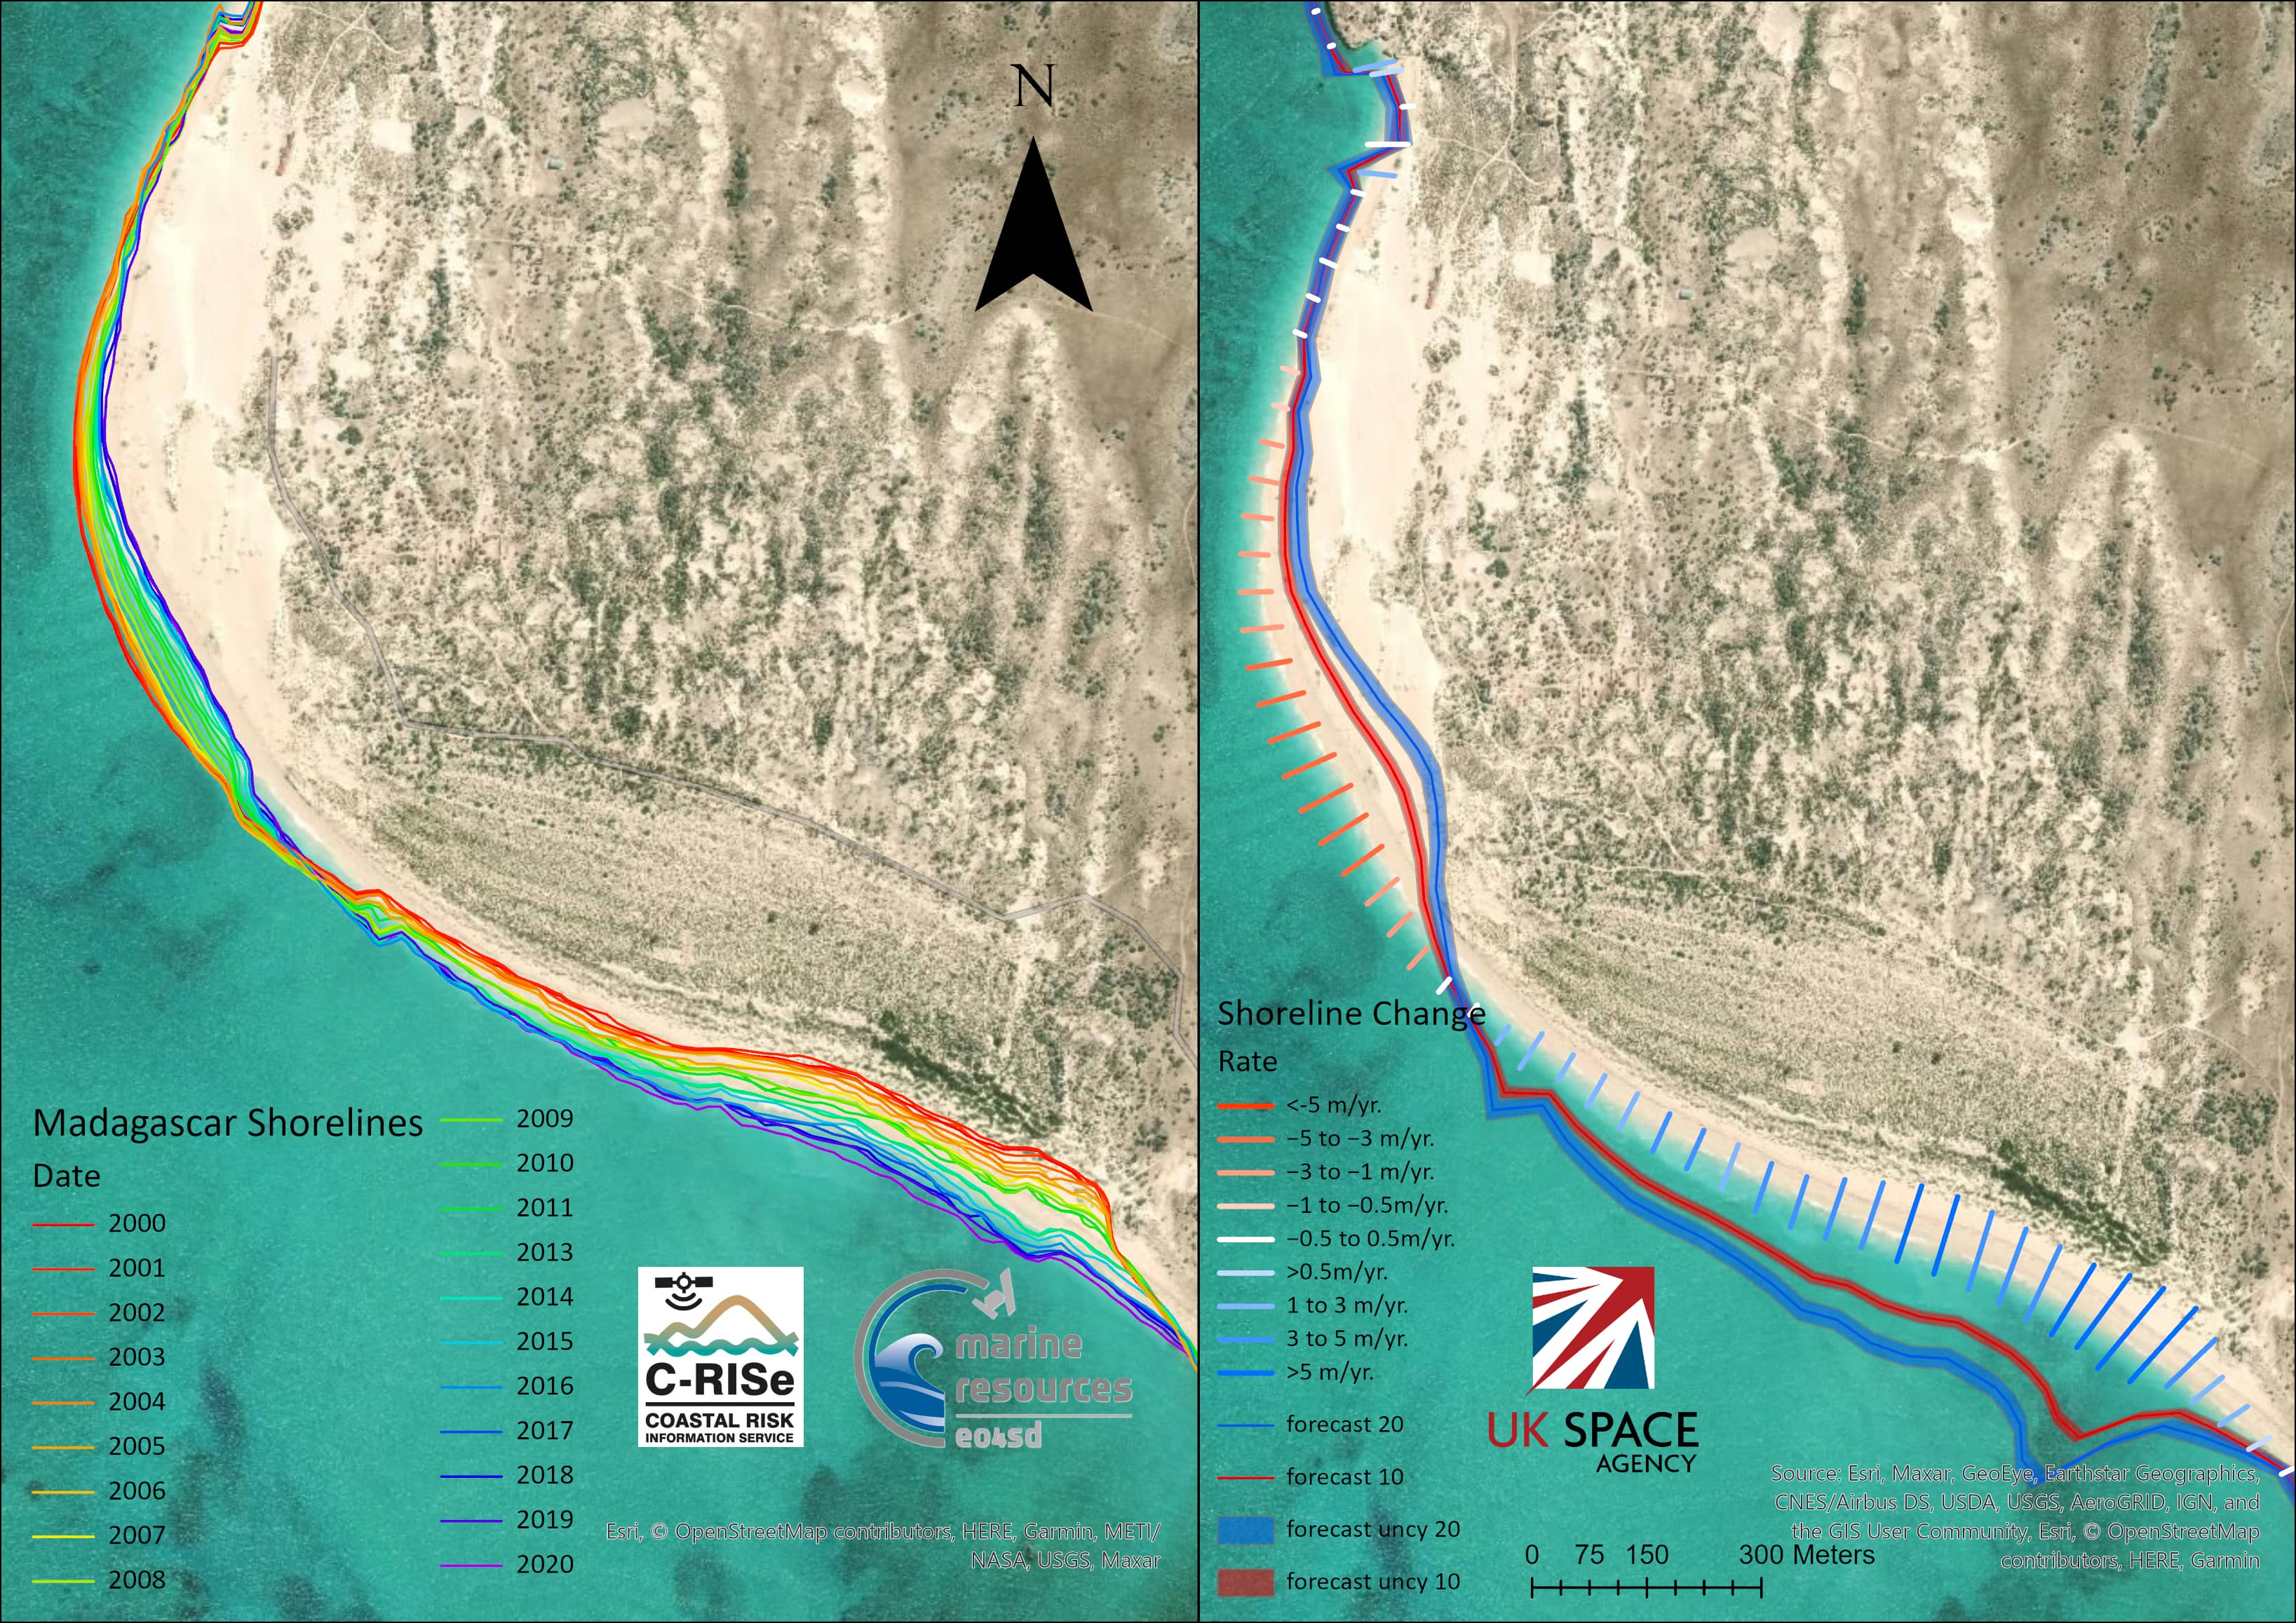
| Madagascar Historical Shorelines, Shoreline Change Rates (2000-2020) and 10- and 20-year forecast - Version 2 |
 (866 KB) |
Version 2 - Unvalidated, merged landsat imagery and updated cloud masking process.This layer consists of data used to map shoreline change rates in Madagascar produced by the National Oceanography Centre for the Marine and Coastal Resources project under the initiative Earth Observation for Sustainable Development (EO4SD) by the European Space Agency. Geodatabase contains: Admin boundary - administrative boundary of coastline Madagascar Shorelines - Each shoreline delineated from the 20-year period Forecast 10 [years] Forecast 20 [years] Forecast Uncertainty 10 [years] Forecast Uncertainty 20 [years] Shoreline change rates - transects Historical shorelines between 2000-2020 can be visualised, created by annual median composites of Landsat 7 and 8 imagery which delineates the approximate mean high water mark. Methods are inspired by Coastsat, a Google Earth Engine-enabled open-source software toolkit that delineates shorelines at any sandy coastline worldwide from over 30 years of publicly available satellite imagery (https://github.com/kvos/CoastSat). |
Madagascar | 2000 - 2020 |
Shapefiles (ZIP, 178.7 MB) GDB file (ZIP, 90.2 MB) Metadata (XML, 8KB) |
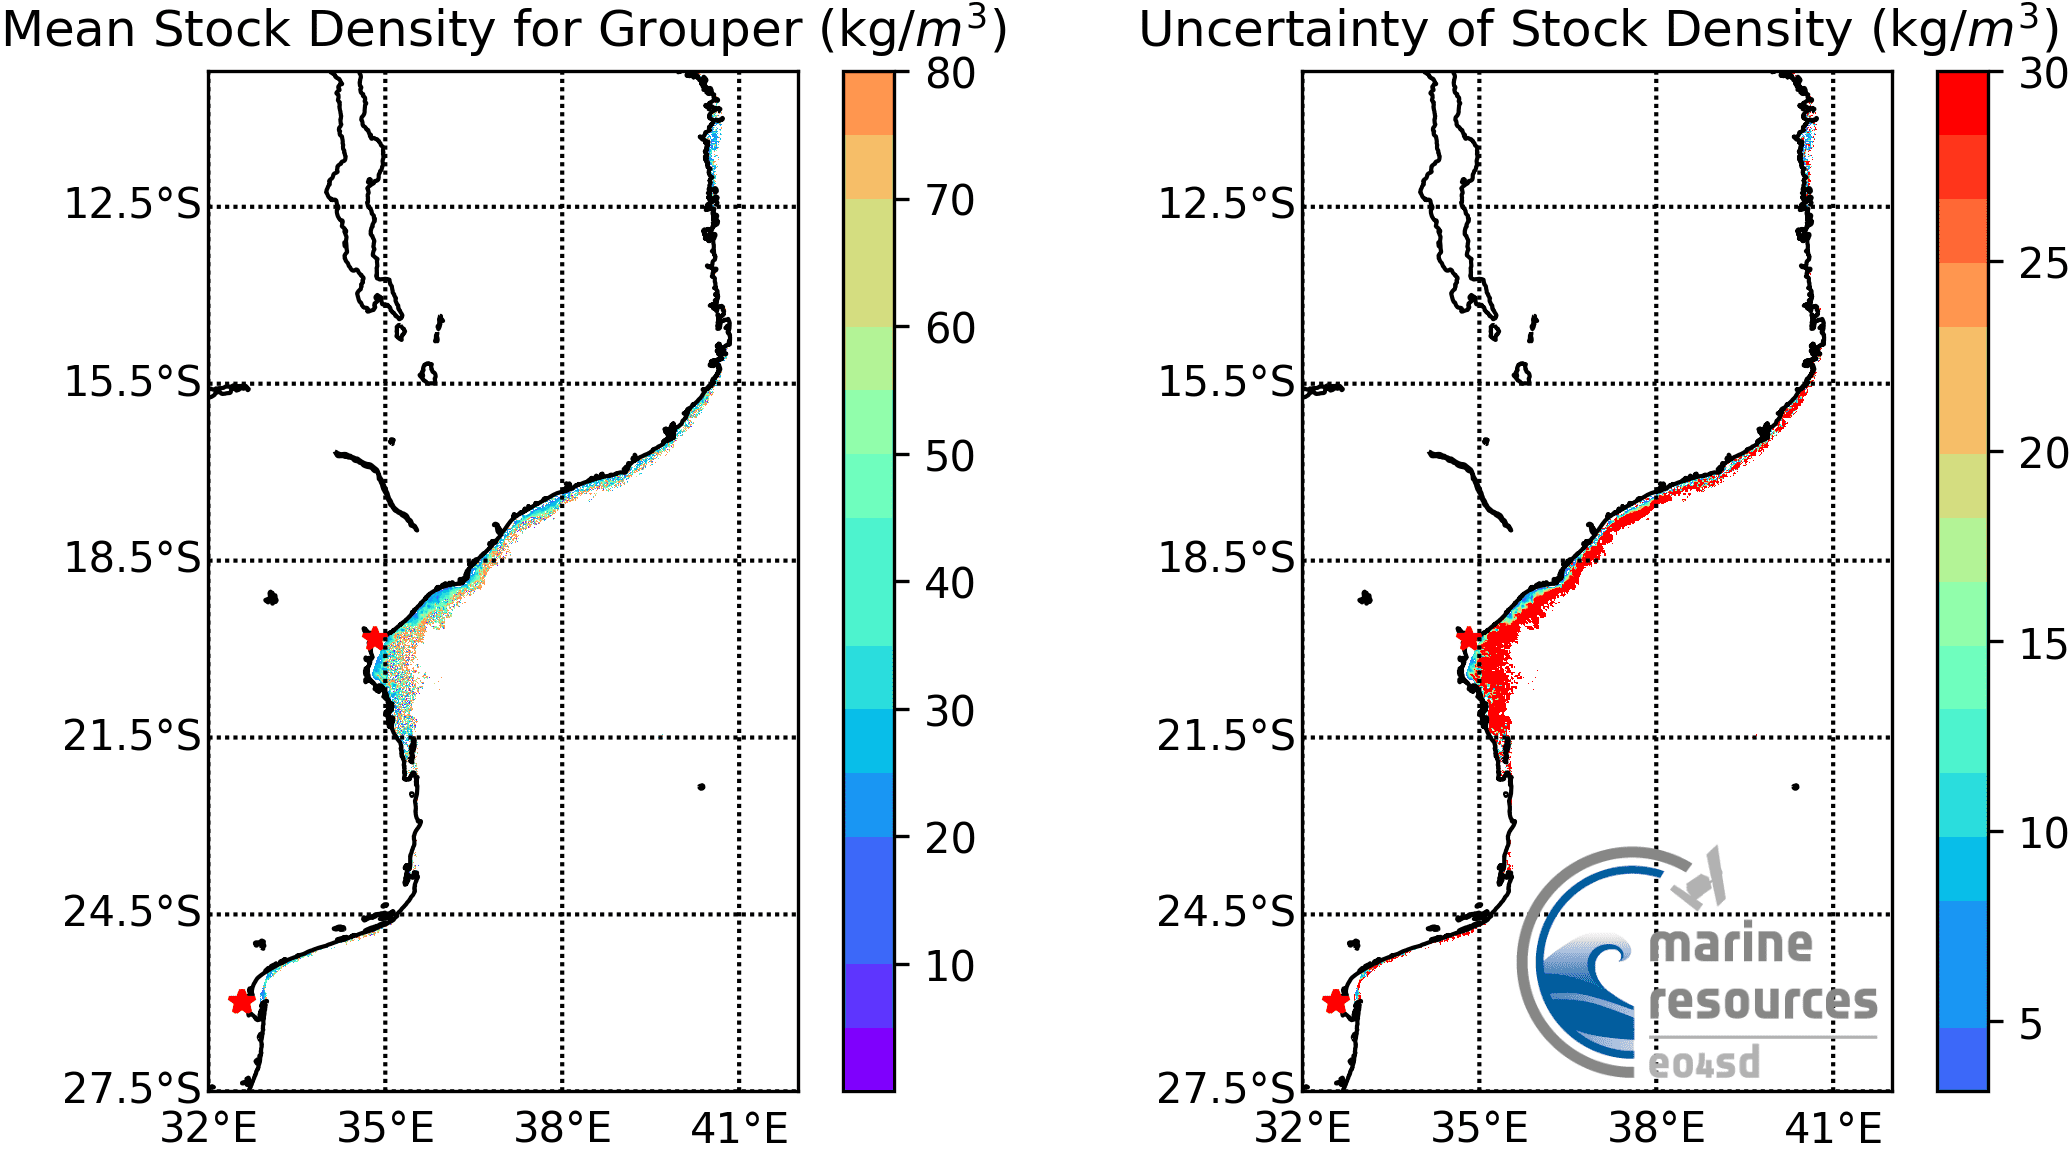
| EO4SD Mozambique v1 finfish mean stock density grouper |
 (80 KB) |
Map of finfish mean stock density along Mozambique coast. | Mozambique | 20200401 - 20200831 | GIS data (TIFF, 16 MB) Metadata (XML, 2.6 KB) |
| EO4SD Mozambique v1 finfish site selection |
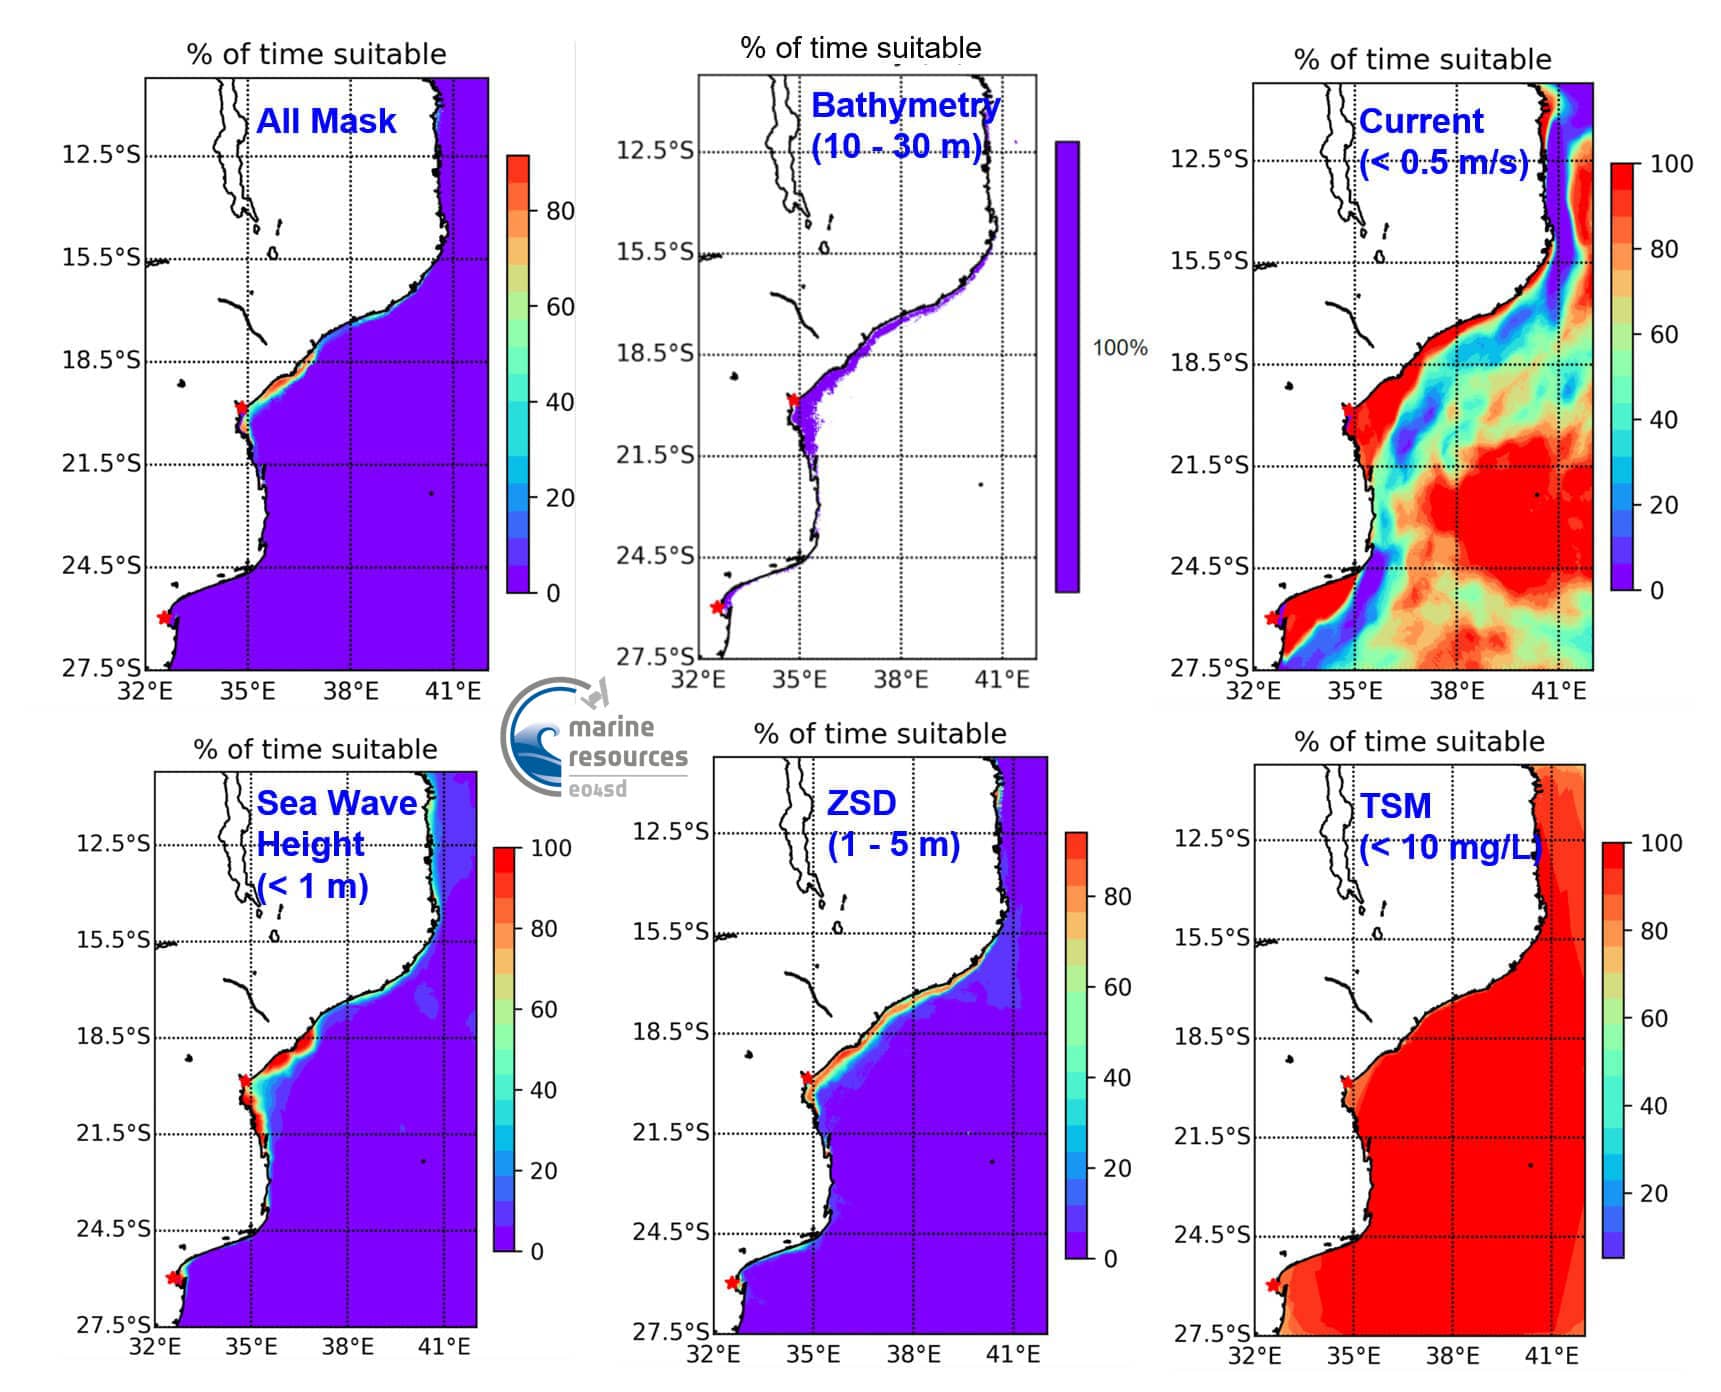 (80 KB) |
Map of finfish site selection along Mozambique coast. | Mozambique | 20200401 - 20200831 | GIS data (TIFF, 16 MB) Metadata (XML, 2.7 KB) |
| EO4SD Mozambique v1 finfish mean stock density seabass |
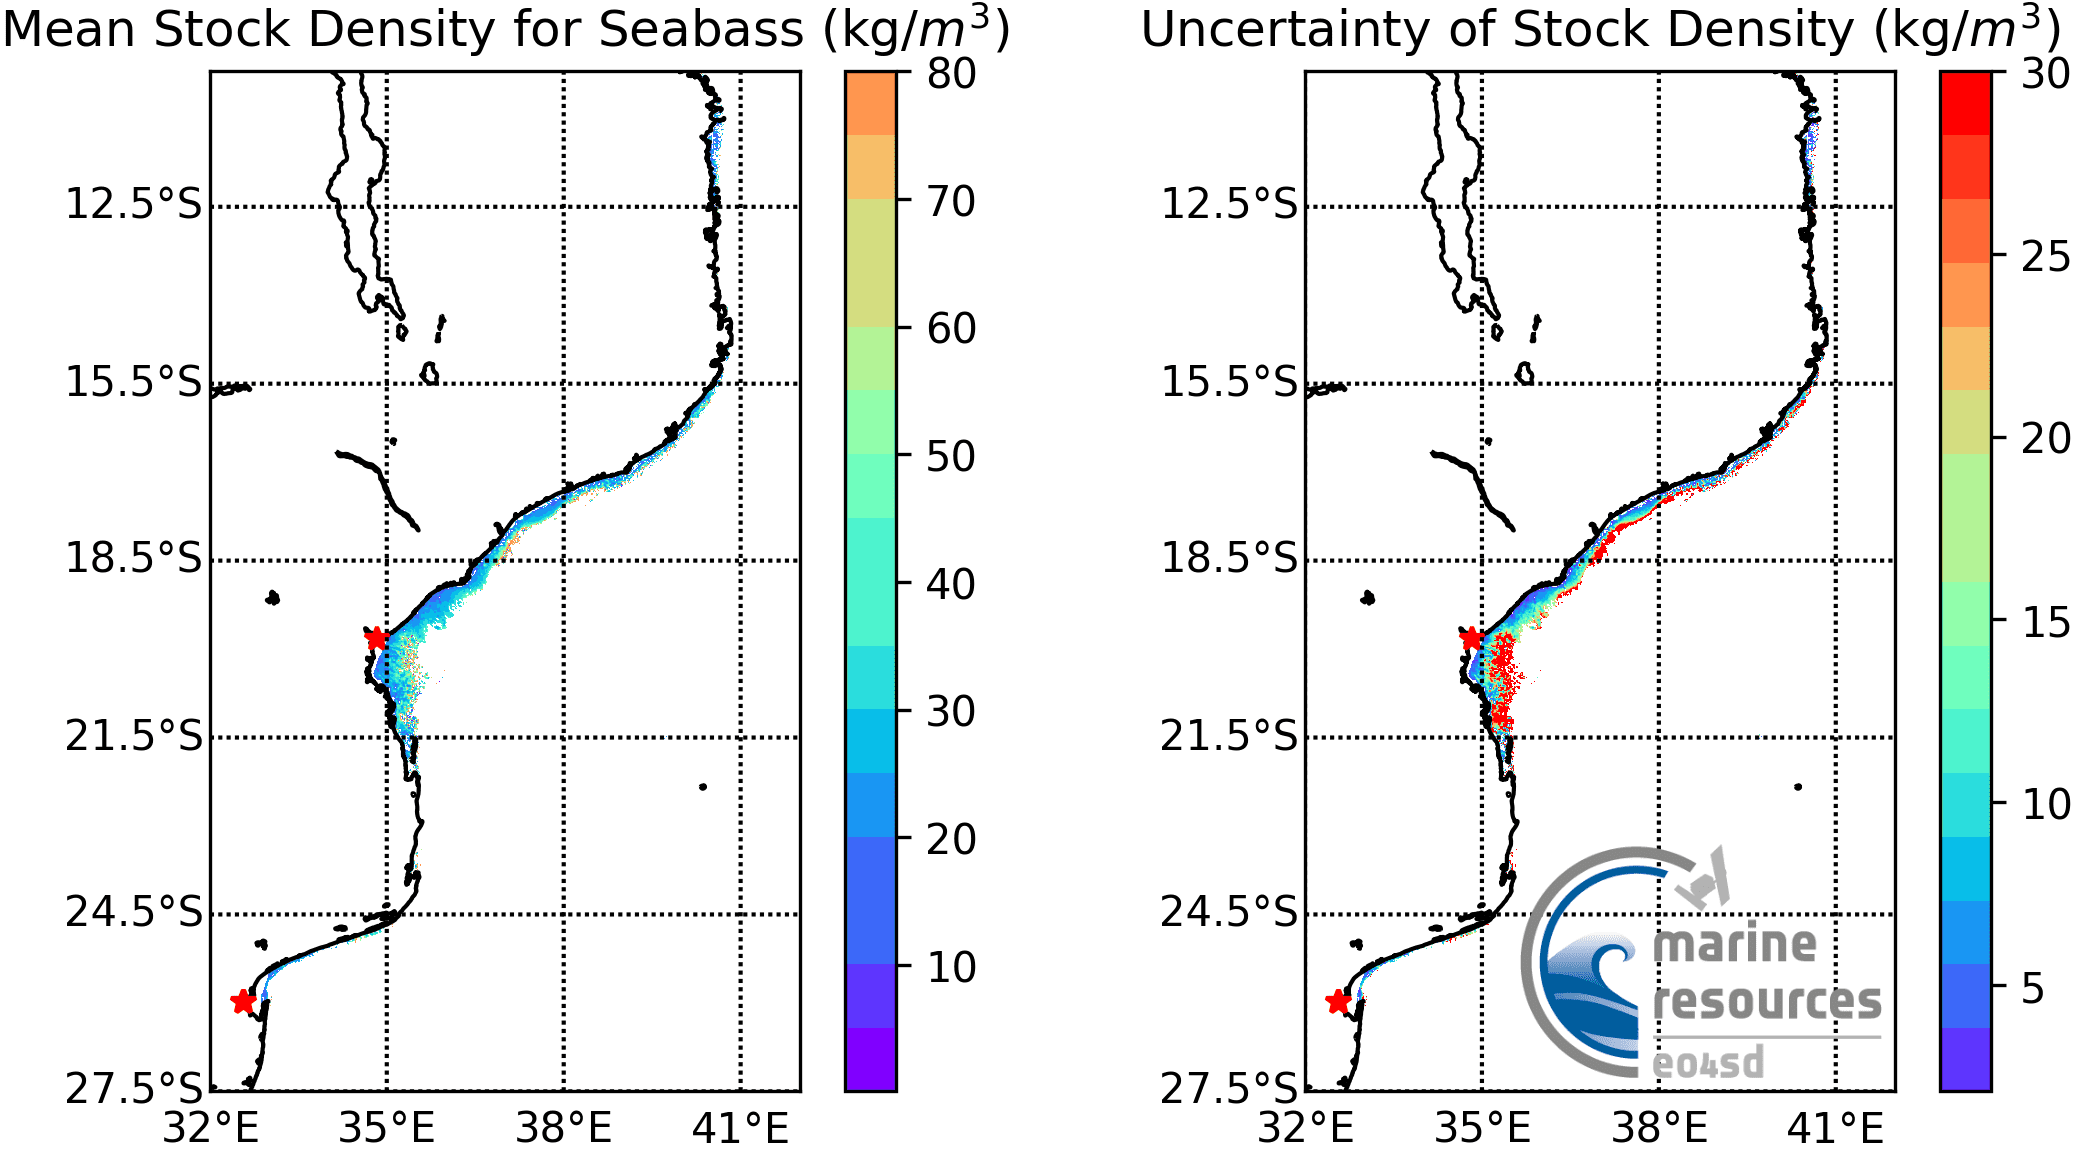 (80 KB) |
Map of finfish mean stock density along Mozambique coast. | Mozambique | 20200401 - 20200831 | GIS data (TIFF, 16 MB) Metadata (XML, 2.6 KB) |